Simulation of Fospropofol Pharmacokinetics
To reference this educational web simulation according to the APA style for Web references, use: Please visit and contribute to our Wiki page on fospropofol pharmacokinetics (PK). |
|
|
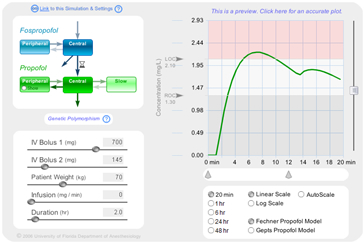
This simulation is temporarily unavailable. It will be rebuilt using recently available data. This interactive simulation of PK is based on a 5-compartment model from Fechner et al, Anesthesiology 99:303-13, 2003. Two compartments are used to model fospropofol PK and three compartments for propofol PK, including a slow peripheral compartment. Users can select either the Fechner (default) or the Gepts model for propofol. Users can adjust the following variables and visualize the essential effects of their interventions on fospropofol or propofol concentration in any of the 5 compartments: weight, infusion rate,infusion duration, dose of initial and second bolus dose and timing of second bolus. The first 5 variables can be adjusted either by the slider bars or by placing the cursor in the desired number field and manually entering numbers from the keyboard. To adjust the timing of the second bolus, click and drag the syringe icon representing the second bolus. Plot parameters are also user-adjustable. The range of time durations represented on the X axis can be 20 min, 1 hr, 6 hrs, 24 hrs and 48 hrs. The concentration values on the Y axis can be plotted on a linear scale or a log 10 scale. The Y-axis autoscale feature can be toggled off and the Y scale manually adjusted, if desired. By default, only the concentration in the propofol central compartment is plotted. To plot concentration in other compartments, mouse over the representation of the desired compartment; click on the “Show” button that will appear. For sedation, the default values of the user adjustable lower (ROC – recovery of response to verbal command) and upper thresholds (LOC – loss of response to verbal command) are 1.3 and 2.1 mg/L (mcg/ml). Clicking on the Genetic Polymorphism button generates different plots simulating the variability between individual patients. The simulation, once configured to the desired settings, can be saved by clicking on the “Link to this simulation and settings” icon. This will modify the URL in the address bar. Cut and paste that modified URL into email, documents, Powerpoint files or web pages so that the simulation initializes at the desired settings. |
||